Abstract
Ozone data retrieved in the Arctic region from infrared radiance spectra recorded by the Infrared Atmospheric Sounding Interferometer (IASI) on board the MetOp-A European satellite are presented. They are compared with in situ and lidar observations obtained during a series of aircraft measurement campaigns as part of the International Polar Year POLARCAT activities in spring and summer 2008. Different air masses were sampled during the campaigns including clean air, polluted plumes originating from anthropogenic sources, forest fire plumes from the three northern continents, and stratospheric-influenced air masses. The comparison between IASI O3 [0-8 km], [0-12 km] partial columns and profiles with collocated aircraft observations is achieved by taking into account the different sensitivity and geometry of the sounding instruments. A detailed analysis is provided and the agreement is discussed in terms of vertical sensitivity and surface properties at the location of the observations. Overall, IASI O3 profiles are found to be in relatively good agreement with smoothed in situ and lidar profiles in the free troposphere with differences of less than 40% (25% over sea for both seasons) and 10%, respectively. The correlation between IASI O3 retrieved partial columns and the smoothed aircraft partial columns is good with DC-8 in situ data in spring over North America (r= Combining double low line 0.68), and over Greenland with ATR-42 lidar measurements in summer (r= Combining double low line 0.67). Correlations with other data are less significant highlighting the difficulty of IASI to capture precisely the O3 variability in the Arctic upper troposphere and lower stratosphere (UTLS). This is particularly noted in comparison with the [0-12 km] partial columns. The IASI [0-8 km] partial columns display a low negative bias (by less than 26% over snow) compared to columns derived from in situ measurements. Despite the relatively high biases of the IASI retrievals in the Arctic UTLS, our analysis shows that IASI can be used to identify, using O3/CO ratios, stratospheric intrusions. © 2012 Author(s).
Figures
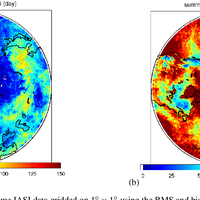
![Fig. 4. Maps of IASI [0–8 km] O3 columns (a) and corresponding DOFS (b) on a 1◦× 1◦ grid for the spring campaign for daytime (top) and night-time (bottom). White areas indicate no data.](https://s3-eu-west-1.amazonaws.com/com.mendeley.prod.article-extracted-content/images/a80d64c8-5c0e-3aef-845f-459916d1fd94/thumbnail-4fb67cce-3464-446b-861c-5770905feec8-3.png)
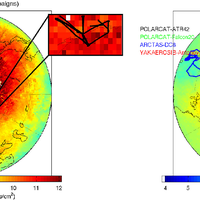
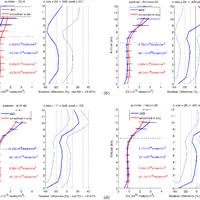
![Fig. 6. Left panel: average IASI O3 profiles (blue lines) and smoothed in situ profiles (red lines) in units of 1012 molecules cm−3 for each spring aircraft campaign; the horizontal dashed black line represents the mean position of the maximum altitude reached by each particular aircraft. Error bars represent the variability of averaged smoothed data (standard deviation±1 σ). The coloured numbers indicate the average [0–8 km] columns in 1017 molecules cm−2 together with the standard deviation. Right panel: average relative difference (RD) in % (thick blue lines for profiles and numbers below the graphs on the right are the average differences for [0–8 km] columns) and ±1 σ (thin blue lines). The number of in situ observations and IASI co-located pixels are noted at the top of the panels on the right. The relative differences are calculated as follows: [(IASI – smoothed in situ)/(smoothed in situ)]× 100 %. The smoothed in situ profiles are the in situ aircraft measurements completed with the ACE-FTS climatology and convolved with IASI AK (see text for details). Results are shown for the DC-8 (a), the WP-3D (b) and the ATR-42 (c). The mean ECMWF dynamical tropopause is at 8, 8.5 and 7.8 km, respectively.](https://s3-eu-west-1.amazonaws.com/com.mendeley.prod.article-extracted-content/images/a80d64c8-5c0e-3aef-845f-459916d1fd94/thumbnail-a1782911-4753-4211-a710-eba501ec2d1c-5.png)
Register to see more suggestions
Mendeley helps you to discover research relevant for your work.
Cite
CITATION STYLE
Pommier, M., Clerbaux, C., Law, K. S., Ancellet, G., Bernath, P., Coheur, P. F., … Weinheimer, A. J. (2012). Analysis of IASI tropospheric O3 data over the Arctic during POLARCAT campaigns in 2008. Atmospheric Chemistry and Physics, 12(16), 7371–7389. https://doi.org/10.5194/acp-12-7371-2012
