Circumpolar measurements of speciated mercury, ozone and carbon monoxide in the boundary layer of the Arctic Ocean

39Citations
Citations of this article
40Readers
Mendeley users who have this article in their library.

Abstract

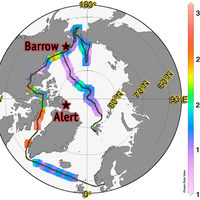
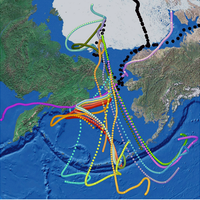
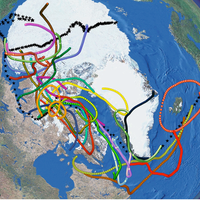
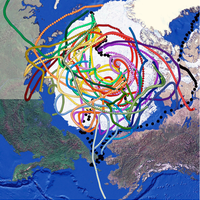
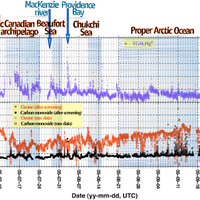
Using the Swedish icebreaker Oden as a platform, continuous measurements of airborne mercury (gaseous elemental mercury (Hg), divalent gaseous mercury species HgIIX2(g) (acronym RGM) and mercury attached to particles (PHg)) and some long-lived trace gases (carbon monoxide CO and ozone O3) were performed over the North Atlantic and the Arctic Ocean. The measurements were performed for nearly three months (Julyg-September 2005) during the Beringia 2005 expedition (from Göteborg, Sweden via the proper Northwest Passage to the Beringia region Alaska-Chukchi Penninsula-Wrangel Island and in-turn via a north-polar transect to Longyearbyen, Spitsbergen). The Beringia 2005 expedition was the first time that these species have been measured during summer over the Arctic Ocean going from 60° to 90° N. During the North Atlantic transect, concentration levels of Hg, CO and O 3 were measured comparable to typical levels for the ambient mid-hemispheric average. However, a rapid increase of Hg in air and surface water was observed when entering the ice-covered waters of the Canadian Arctic archipelago. Large parts of the measured waters were supersaturated with respect to Hg, reflecting a strong disequilibrium. Heading through the sea ice of the Arctic Ocean, a fraction of the strong Hg pulse in the water was transferred with some time-delay into the air samples collected ∼20 m above sea level. Several episodes of elevated Hg in air were encountered along the sea ice route with higher mean concentration (1.81±0.43 ng m-3) compared to the marine boundary layer over ice-free Arctic oceanic waters (1.55±0.21 ng m-3). In addition, the bulk of the variance in the temporal series of Hg concentrations was observed during July. The Oden Hg observations compare in this aspect very favourably with those at the coastal station Alert. Atmospheric boundary layer O3 mixing ratios decreased when initially sailing northward. In the Arctic, an O3 minimum around 15-20 ppbV was observed during summer (July-August). Alongside the polar transect during the beginning of autumn, a steady trend of increasing O3 mixing ratios was measured returning to initial levels of the expedition (>30 ppbV). Ambient CO was fairly stable (84±12 ppbV) during the expedition. However, from the Beaufort Sea and moving onwards steadily increasing CO mixing ratios were observed (0.3 ppbV day-1). On a comparison with coeval archived CO and O3 data from the Arctic coastal strip monitoring sites Barrow and Alert, the observations from Oden indicate these species to be homogeneously distributed over the Arctic Ocean. Neither correlated low ozone and Hg events nor elevated concentrations of RGM and PHg were at any extent sampled, suggesting that atmospheric mercury deposition to the Arctic basin is low during the Polar summer and autumn. © Author(s) 2010.

Figures

  • Table 1. Information concerning the air sampling protocol onboard IB Oden (4th deck).
  • Figure 1. The spatial distribution of TGM, Hg0 in air (ng m-3) along the cruise track. The locations of coastal stations Alert (Nunavut, Canada) and Barrow (Alaska, USA) are included as well. Fig. 1. The spatial distribution of TGM, Hg 0 in air (ng m−3) along the cruise track. The locations of coastal stations Alert (Nunavut, Canada) and Barrow (Alaska, USA) are included as well.
  • Figure 3. Cruise track illustrated by ship’s position every 6 h (black dots) and for the two first weeks of August plots of selected five-day back-trajectories starting at 100-1,800 m above sea level. The offset in starting elevation was chosen individually to produce a purposeful stable trajectory lacking of significant ground contact. Concerning the TGM, Hg0; CO pollution event described in Section 3.1.2., trajectories with 6 h interval starting times are depicted (reddish coloured). The snow/ice coverage shown in the image does not represent the actual distribution during the cruise.
  • Figure 2. Cruise track illustrated by ship’s position every 6 h (black stars) and for July plots of selected daily five-day back-trajectories starting (usually at 12 h UTC) at 100-1,500 m above sea level. The offset in starting elevation was chosen individually to produce a purposeful stable trajectory lacking of significant ground contact. The snow/ice coverage shown in the image does not represent the actual distribution during the cruise.
  • Figure 4. Cruise track illustrated by ship’s position every 6 h (black dots) and for August (weeks 3-5) and September (weeks 1-3) plots of selected daily five-day back-trajectories starting (usually at 12 h UTC) at 300-2,500 m above sea level. The offset in starting elevation was chosen individually to produce a purposeful stable trajectory lacking of significant ground contact. The snow/ice coverage shown in the image does not represent the actual distribution during the cruise.
  • Figure 5. 10-min averaged concentrations of atmospheric trace gases TGM, Hg0; O3; CO over the northern Atlantic and Arctic Ocean measured onboard the IB Oden during BERINGIA 2005. Passage through ice-covered sea is shaded in bluish colours. The names of some important geographical area discernible in Figure 1 are indicated as well.
  • Table 2. Summary of the measurements after screening the raw data from local combustion.
  • Table 3. Summary of screened TGM, Hg0; O3 and CO data applicable to the Arctic Ocean (incl. Baffin Bay, Northwest Passages, Beaufort Sea, Chukchi Sea, and Greenland Sea). Excluded are thus data from the North Atlantic Ocean, Labrador Sea and Bering Sea (IHO, 1953). Descriptive statistics of TGM data from station Alert on Ellesmere Island are included as well.

Cited by Powered by Scopus

205Citations
153Readers
Get full text

Register to see more suggestions

Mendeley helps you to discover research relevant for your work.

Already have an account?

Cite

CITATION STYLE

APA

Sommar, J., Andersson, M. E., & Jacobi, H. W. (2010). Circumpolar measurements of speciated mercury, ozone and carbon monoxide in the boundary layer of the Arctic Ocean. Atmospheric Chemistry and Physics, 10(11), 5031–5045. https://doi.org/10.5194/acp-10-5031-2010

Readers over time

‘10‘11‘12‘13‘16‘17‘18‘19‘21‘22‘2402468

Readers' Seniority

Tooltip

Researcher 16

50%

PhD / Post grad / Masters / Doc 12

38%

Professor / Associate Prof. 4

13%

Readers' Discipline

Tooltip

Environmental Science 16

62%

Earth and Planetary Sciences 5

19%

Chemistry 4

15%

Chemical Engineering 1

4%

Save time finding and organizing research with Mendeley

Sign up for free
0