Abstract
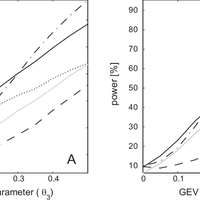
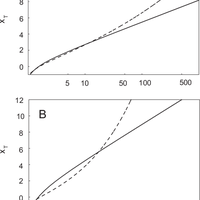
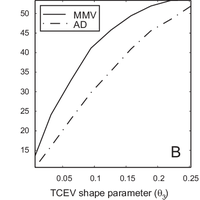
Validation of probabilistic models based on goodness-of-fit tests is an essential step for the frequency analysis of extreme events. The outcome of standard testing techniques, however, is mainly determined by the behavior of the hypothetical model, FΧ(x) in the central part of the distribution, while the behavior in the tails of the distribution, which is indeed very relevant in hydrological applications, is relatively unimportant for the results of the tests. The maximum-value test, originally proposed as a technique for outlier detection, is a suitable, but seldom applied, technique that addresses this problem. The test is specifically targeted to verify if the maximum (or minimum) values in the sample are consistent with the hypothesis that the distribution FΧ(x) is the real parent distribution. The application of this test is hindered by the fact that the critical values for the test should be numerically obtained when the parameters of F Χ(x) are estimated on the same sample used for verification, which is the standard situation in hydrological applications. We propose here a simple, analytically explicit, technique to suitably account for this effect, based on the application of censored L-moments estimators of the parameters. We demonstrate, with an application that uses artificially generated samples, the superiority of this modified maximum-value test with respect to the standard version of the test. We also show that the test has comparable or larger power with respect to other goodness-of-fit tests (e.g., chi-squared test, Anderson-Darling test, Fung and Paul test), in particular when dealing with small samples (sample size lower than 20-25) and when the parent distribution is similar to the distribution being tested. © 2010 Author(s).
Figures
Register to see more suggestions
Mendeley helps you to discover research relevant for your work.
Cite
CITATION STYLE
Laio, F., Allamano, P., & Claps, P. (2010). Exploiting the information content of hydrological “outliers” for goodness-of-fit testing. Hydrology and Earth System Sciences, 14(10), 1909–1917. https://doi.org/10.5194/hess-14-1909-2010

![Table 1. Probability models considered in this paper. 0[·] is the gamma function.](https://s3-eu-west-1.amazonaws.com/com.mendeley.prod.article-extracted-content/images/b160e2d9-a8dc-3d9c-855d-5d23addcb5f0/thumbnail-f3a8b00c-8c84-476b-aa9f-21b86c5531ac-0.png)
![Table 2. Distribution dependent functions to be used for parameter estimation, as defined in Eqs. (6 and 10). 0[·] is the gamma function, 0[·;·] is the incomplete gamma function, and Norminv is the inverse of the standardized Gaussian cumulative distribution function.](https://s3-eu-west-1.amazonaws.com/com.mendeley.prod.article-extracted-content/images/b160e2d9-a8dc-3d9c-855d-5d23addcb5f0/thumbnail-c401add2-7181-408e-8c05-49bb3b3523db-1.png)


