Global glacier changes: A revised assessment of committed mass losses and sampling uncertainties

72Citations
Citations of this article
115Readers
Mendeley users who have this article in their library.

Abstract

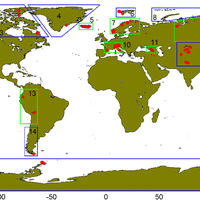
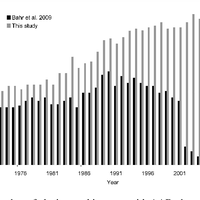
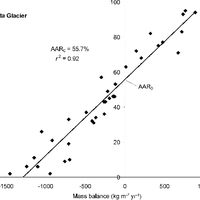
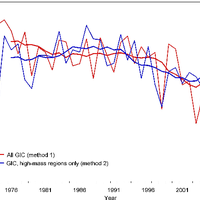
Most glaciers and ice caps (GIC) are out of balance with the current climate. To return to equilibrium, GIC must thin and retreat, losing additional mass and raising sea level. Because glacier observations are sparse and geographically biased, there is an undersampling problem common to all global assessments. Here, we further develop an assessment approach based on accumulation-area ratios (AAR) to estimate committed mass losses and analyze the undersampling problem. We compiled all available AAR observations for 144 GIC from 1971 to 2010, and found that most glaciers and ice caps are farther from balance than previously believed. Accounting for regional and global undersampling errors, our model suggests that GIC are committed to additional losses of 32 ± 12% of their area and 38 ± 16% of their volume if the future climate resembles the climate of the past decade. These losses imply global mean sea-level rise of 163 ± 69 mm, assuming total glacier volume of 430 mm sea-level equivalent. To reduce the large uncertainties in these projections, more long-term glacier measurements are needed in poorly sampled regions. © 2013 Author(s).

Figures

  • Fig. 1. Locations of the 144 glaciers and ice caps (GIC) in the updated data set. The data are divided into 16 regions: (1) Alaska, (2) western Canada/US, (3) Arctic Canada, (4) Greenland, (5) Iceland, (6) Svalbard, (7) Scandinavia, (8) the Russian Arctic, (9) North Asia, (10) central Europe, (11) the Caucasus, (12) central Asia, (13) the northern Andes, (14) the southern Andes, (15) New Zealand, and (16) Antarctica. The data set contains 38 GIC in high-mass regions (ice volume V > 5000 km3, outlined in blue) and 106 GIC in low-mass regions (V < 5000 km3, outlined in green). Volume estimates are from Radić et al. (2013).
  • Fig. 2. Number of glaciers and ice caps with AAR observations per year in the Bahr et al. (2009) data set (black) and in the updated data set used in this study (grey).
  • Fig. 3. Linear regression of AAR against mass balance for Silvretta Glacier, Swiss Alps. The y intercept is AAR0, the equilibrium value of AAR. Each diamond represents one year of data.
  • Fig. 4. Annual average α = AAR / AAR0 for the full data set (thin red line) and for the GIC in high-mass regions only (thin blue line), 1971–2010. The thick red and blue lines are 10 yr running means. Both the full data set and the high-mass-only data sets have significant (p < 0.01) negative trends during the periods 1971–2010 and 1991–2010. The 1971–1990 trends are not significant (p > 0.10).
  • Fig. 5. Linear relation between the log of area (km2) and the 2001– 2010 mean α = AAR / AAR0 for 96 GIC with observations in the past decade. Each diamond represents one glacier or ice cap. The correlation between α and the log of area, although slightly positive (r2 = 0.03), is insignificant (p > 0.10), suggesting that a bias toward smaller glaciers does not imply a bias in α.
  • Table 1. Regional mean values of α = AAR / AAR0 for 2001– 2010∗.
  • Fig. 6. Spread of decadal mean α as a function of subsample size in well-sampled regions. This plot shows the maximum difference between subsample mean α and reference 〈α〉 as a function of the number of glaciers in the subsample for (a) two well-sampled regions: region 1, central Europe; and region 2, western Canada/US. (b) The same regions but extended: region 3, central Europe and Scandinavia; and region 4, western Canada/US and Alaska. The reference 〈α〉 is the mean of the full sample, which includes glaciers with continuous AAR series during the period 2001–2010. In red is the difference range at 95 % confidence interval (1.96× standard deviation) for region 1 and region 3.
  • Fig. 7. Pentadal average mass balance, 1971–2010. Estimated global average GIC mass balance (kg m−2 yr−1) at 5 yr intervals from published estimates and from this data set: (1) Kaser et al. (2006), based on direct glacier measurements (purple); (2) Cogley (2012), based on direct plus geodetic measurements (yellow); (3) Gardner et al. (2013), with 95 % confidence interval for 2003– 2009 (black); (4) arithmetic mean of all GIC in the 1971–2010 data set (method 1, red); (5) arithmetic mean of GIC in the eight highmass regions of Fig. 1 (method 2, blue); (6) average based on areaweighted upscaling of regional means (method 3, green) including error bars at 95 % confidence interval.

Register to see more suggestions

Mendeley helps you to discover research relevant for your work.

Already have an account?

Cite

CITATION STYLE

APA

Mernild, S. H., Lipscomb, W. H., Bahr, D. B., Radić, V., & Zemp, M. (2013). Global glacier changes: A revised assessment of committed mass losses and sampling uncertainties. Cryosphere, 7(5), 1565–1577. https://doi.org/10.5194/tc-7-1565-2013

Readers over time

‘13‘14‘15‘16‘17‘18‘19‘20‘21‘22‘23‘24‘250481216

Readers' Seniority

Tooltip

PhD / Post grad / Masters / Doc 37

44%

Researcher 32

38%

Professor / Associate Prof. 10

12%

Lecturer / Post doc 5

6%

Readers' Discipline

Tooltip

Earth and Planetary Sciences 64

76%

Environmental Science 12

14%

Engineering 5

6%

Agricultural and Biological Sciences 3

4%

Article Metrics

Tooltip
Mentions
References: 1

Save time finding and organizing research with Mendeley

Sign up for free
0