Abstract
Regional climate change impact (CCI) studies have widely involved downscaling and bias correcting (BC) global climate model (GCM)-projected climate for driving land surface models. However, BC may cause uncertainties in projecting hydrologic and biogeochemical responses to future climate due to the impaired spatiotemporal covariance of climate variables and a breakdown of physical conservation principles. Here we quantify the impact of BC on simulated climate-driven changes in water variables (evapotranspiration (ET), runoff, snow water equivalent (SWE), and water demand for irrigation), crop yield, biogenic volatile organic compounds (BVOC), nitric oxide (NO) emissions, and dissolved inorganic nitrogen (DIN) export over the Pacific Northwest (PNW) region. We also quantify the impacts on net primary production (NPP) over a small watershed in the region (HJ-Andrews). Simulation results from the coupled ECHAM5-MPI-OM model with A1B emission scenario were first dynamically downscaled to 12 km resolution with the WRF model. Then a quantile-mapping-based statistical downscaling model was used to downscale them into 1/16° resolution daily climate data over historical and future periods. Two climate data series were generated, with bias correction (BC) and without bias correction (NBC). Impact models were then applied to estimate hydrologic and biogeochemical responses to both BC and NBC meteorological data sets. These impact models include a macroscale hydrologic model (VIC), a coupled cropping system model (VIC-CropSyst), an ecohydrological model (RHESSys), a biogenic emissions model (MEGAN), and a nutrient export model (Global-NEWS). Results demonstrate that the BC and NBC climate data provide consistent estimates of the climate-driven changes in water fluxes (ET, runoff, and water demand), VOCs (isoprene and monoterpenes) and NO emissions, mean crop yield, and river DIN export over the PNW domain. However, significant differences rise from projected SWE, crop yield from dry lands, and HJ-Andrews's ET between BC and NBC data. Even though BC post-processing has no significant impacts on most of the studied variables when taking PNW as a whole, their effects have large spatial variations and some local areas are substantially influenced. In addition, there are months during which BC and NBC post-processing produces significant differences in projected changes, such as summer runoff. Factor-controlled simulations indicate that BC post-processing of precipitation and temperature both substantially contribute to these differences at regional scales. We conclude that there are trade-offs between using BC climate data for offline CCI studies versus directly modeled climate data. These trade-offs should be considered when designing integrated modeling frameworks for specific applications; for example, BC may be more important when considering impacts on reservoir operations in mountainous watersheds than when investigating impacts on biogenic emissions and air quality, for which VOCs are a primary indicator. © 2014 Author(s).
Figures
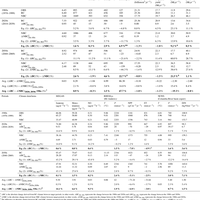
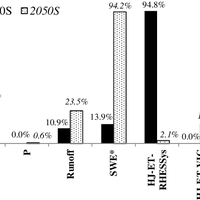
![Fig. 3. Differences in the percentage change between BC and NBC climate data and the simulated outputs driven by bias-corrected (BC) and non-bias-corrected (NBC) climate. They are calculated as [1BC20s-80s (%) −1NBC20s-80s (%)] for the change between the 1980s and 2020s and [1BC50s-80s (%) −1NBC50s-80s (%)] for the change between the 1980s and 2050s. For T , it is total differences in degrees Celsius, i.e., (1BC20s-80s −1NBC20s-80s) for the change between the 1980s and 2020s, and (1BC50s-80s −1NBC50s-80s) for the change between the 1980s and 2050s. T : annual mean temperature; P : average annual precipitation; ET: average annual evapotranspiration; Runoff: total runoff; SWE: snowpack water equivalent on 1 April; Total YD: total yield from all croplands; Irrig. YD: yield from irrigated cropland; Dry YD: yield from dryland (nonirrigated cropland); WD: total irrigation water demand over irrigated cropland, HJ-ET: RHESSys modeled ET over HJ-Andrews watershed; HJ-NPP: RHESSys modeled net primary production (NPP) over HJ-Andrews watershed; DIN: NEWS modeled dissolved inorganic nitrogen yield over the Columbia River basin. The small stars under or above each column represent p value< 0.05 for the Student t test of differences between BC anomalies and NBC anomalies during the period of the 2020s and 2050s, respectively.](https://s3-eu-west-1.amazonaws.com/com.mendeley.prod.article-extracted-content/images/d3140f54-1e7a-36e9-a530-d61862a8160e/thumbnail-efa6e1ca-481c-491b-a159-e5990464dd6d-3.png)
Register to see more suggestions
Mendeley helps you to discover research relevant for your work.
Cite
CITATION STYLE
Liu, M., Rajagopalan, K., Chung, S. H., Jiang, X., Harrison, J., Nergui, T., … Adam, J. C. (2014). What is the importance of climate model bias when projecting the impacts of climate change on land surface processes? Biogeosciences, 11(10), 2601–2622. https://doi.org/10.5194/bg-11-2601-2014
