Measurements of the stable carbon isotope composition of dissolved inorganic carbon in the northeastern Atlantic and Nordic Seas during summer 2012

15Citations
Citations of this article
39Readers
Mendeley users who have this article in their library.

Abstract

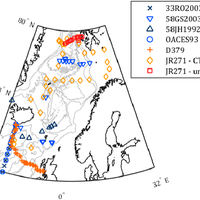
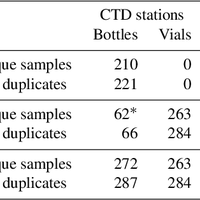
The stable carbon isotope composition of dissolved inorganic carbon (δ 13 C DIC) in seawater was measured in a batch process for 552 samples collected during two cruises in the northeastern Atlantic and Nordic Seas from June to August 2012. One cruise was part of the UK Ocean Acidification research programme, and the other was a repeat hydrographic transect of the Extended Ellett Line. In combination with measurements made of other variables on these and other cruises, these data can be used to constrain the anthropogenic component of dissolved inorganic carbon (DIC) in the interior ocean, and to help to determine the influence of biological carbon uptake on surface ocean carbonate chemistry. The measurements have been processed, quality-controlled and submitted to an in-preparation global compilation of seawater δ 13 C DIC data, and are available from the British Oceanographic Data Centre. The observed δ 13 C DIC values fall in a range from g-0.58 to +2.37 ‰, relative to the Vienna Pee Dee Belemnite standard. The mean of the absolute differences between samples collected in duplicate in the same container type during both cruises and measured consecutively is 0.10 ‰, which corresponds to a μ uncertainty of 0.09 ‰, and which is within the range reported by other published studies of this kind. A crossover analysis was performed with nearby historical δ 13 C DIC data, indicating that any systematic offsets between our measurements and previously published results are negligible. Data doi.org/10.5285/09760a3a-c2b5-250b-e053-6c86abc037c0 (northeastern Atlantic), doi.org/10.5285/09511dd0-51db-0e21-e053-6c86abc09b95 (Nordic Seas).

Figures

  • Figure 1. Sample locations for cruises D379 (orange plusses) and JR271 (CTD stations: gold diamonds; underway: red squares), along with nearby historical δ13CDIC data locations from the Schmittner et al. (2013) compilation: cruises 33RO20030604 (dark-blue crosses), 58GS20030922 (blue inverted triangles), 58JH19920712 (dark-blue triangles) and OACES93 (blue circles). Grey contours indicate bathymetry at 500 m intervals from the GEBCO_2014 grid, version 20141103, http://www.gebco.net.
  • Table 1. Quantities and types of samples collected during cruises JR271 and D379, and types of sample containers used. D379 duplicates where one sample was collected in each type of container are counted in the “Unique samples – Bottles” cell (asterisked). The row labelled “Both (totals)” shows the total number of samples collected during both cruises.
  • Figure 2. Peak area vs. δ13C relationships used for the peak area correction of the calibration standards (a) MAB, (b) NA and (c) CA (Table 2). The grey lines are the linear least-squares best fit for each analysis batch but are vertically translated to have a y intercept of 0, so that the y value of the line at a peak area of 1 is equal to the gradient. The thick black line is the mean gradient for each standard; the dashed grey lines indicate batches excluded from calculation of the mean (see Sect. 4.1.3 for exclusion criteria).
  • Table 2. The SUERC-ICSF in-house calibration standards. The certified values in the final column are the values taken by C in Eq. (4). MAB, NA and CA are the names of the standards, and are not specific abbreviations/acronyms.
  • Figure 3. Peak area vs. δ13C relationship for homogeneous seawater sampled at a range of volumes from 0.5 to 1.5 mL (grey squares). The black best-fit line shows the relationship used to correct all seawater samples for peak area, and the vertical dashed line at (peak area)= 35 indicates the peak area to which corrections have been made.
  • Table 3. Summary of the anomalous measurement removal process for all of the seawater samples. Numbers in each row are for all data after application of the measurement removal step indicated in the first column. Tech. rep. SD: standard deviation of uncalibrated δ13CDIC, calculated for each sample’s set of 10 technical replicates.
  • Figure 4. Standard deviation (SD) of technical replicates for each seawater sample, after anomalous peak removal. Alternating black and grey sections indicate separate analysis batches.
  • Figure 5. Distributions of the difference between calibrated and certified δ13C for calibration standards (a) MAB, (b) NA and (c) CA (Table 2) in all batches. The orange histograms indicate the distributions resulting from using a linear calibration equation, while the overlying black-grey histograms show the improved distributions from the non-linear calibration that we used instead (Eq. 4). SD: standard deviation; N : number of analyses, both in reference to the black-grey histograms, which represent the actual calibration used.

References Powered by Scopus

Ocean acidification: The other CO2 problem

3349Citations
6127Readers
Get full text
3288Citations
3935Readers
Get full text

This article is free to access.

Cited by Powered by Scopus

Isotope systematics of Icelandic thermal fluids

60Citations
63Readers
Get full text

This article is free to access.

Register to see more suggestions

Mendeley helps you to discover research relevant for your work.

Already have an account?

Cite

CITATION STYLE

APA

Humphreys, M. P., Achterberg, E. P., Griffiths, A. M., McDonald, A., & Boyce, A. J. (2015). Measurements of the stable carbon isotope composition of dissolved inorganic carbon in the northeastern Atlantic and Nordic Seas during summer 2012. Earth System Science Data, 7(1), 127–135. https://doi.org/10.5194/essd-7-127-2015

Readers over time

‘15‘16‘17‘18‘19‘20‘21‘22‘23‘24‘2502468

Readers' Seniority

Tooltip

Researcher 10

48%

PhD / Post grad / Masters / Doc 7

33%

Professor / Associate Prof. 4

19%

Readers' Discipline

Tooltip

Earth and Planetary Sciences 14

67%

Environmental Science 4

19%

Agricultural and Biological Sciences 2

10%

Chemistry 1

5%

Save time finding and organizing research with Mendeley

Sign up for free
0