The melting level stability anomaly in the tropics

10Citations
Citations of this article
9Readers
Mendeley users who have this article in their library.

Abstract

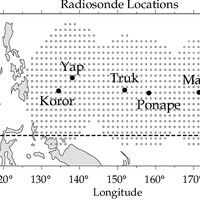
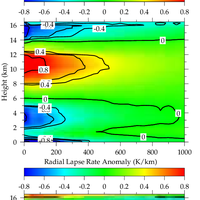
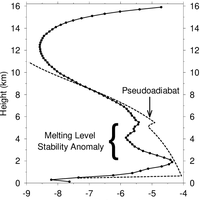
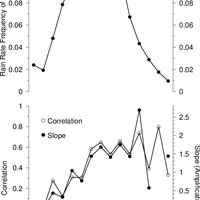
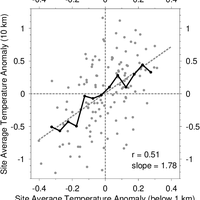
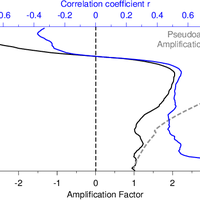
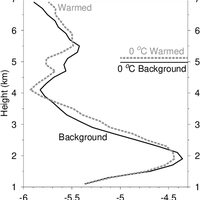
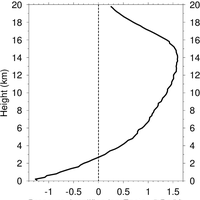
On short timescales, the effect of deep convection on the tropical atmosphere is to heat the upper troposphere and cool the lower troposphere. This stratiform temperature response to deep convection gives rise to a local maximum in stability near the melting level. We use temperature measurements from five radiosonde stations in the Western Tropical Pacific, from the Stratospheric Processes and their Role in Climate (SPARC) archive, to examine the response of this mid-tropospheric stability maximum to changes in surface temperature. We find that the height of the stability maximum increases when the surface temperature increases, by an amount roughly equal to the upward displacement of the 0 °C melting level. Although this response was determined using monthly mean temperature anomalies from an 10 yr record (1999-2008), we use model results to show that a similar response should also be expected on longer timescales. © Author(s) 2013.

Figures

  • Fig. 1. A map showing the locations of the five radiosonde stations. The small gray dots refer to locations of the TRMM rain events used in the construction of the radial temperature anomaly profile shown in Fig. 2. Rain events within 1000 km of multiple radiosonde stations were in general used multiple times in the construction of Fig. 2.
  • Fig. 2. (top) The mean variation in rainfall with distance from high rain events. Rain events were considered to occur at grid boxes where the rain rate in any 3 hour interval exceeded 36 mm day−1. (middle) The temperature anomaly pattern associated with the high rain events. The horizontal axis refers to the distance between the rain event and the radiosonde location. (lower) The lapse rate anomaly associated with the temperature anomaly pattern shown in the middle panel. High rain events are associated with increased stability in the mid-troposphere.
  • Fig. 3. The solid curve with bullets shows the mean lapse rate profile (1999–2008) of the five radiosonde stations discussed in this paper. The dashed curve shows the lapse rate profile of a parcel starting from the surface with a temperature of 299.5 K and relative humidity of 80 %, and subjected to pseudoadiabatic ascent.
  • Fig. 4. (upper) This plot shows the relative frequency of occurrence of monthly mean rain rates from 1999–2008, using TRMM 3B42 rain rates averaged over a 2◦ × 2◦ box centered at each radiosonde location. (lower) Th curve with open circles shows the c rr lation betw en the near surface (belo 1 km) nd 10 km monthly mean temperature anomalies of a radio onde station, s a function of the average rain rate in a 2◦ × 2◦ box centered at each station. The curve with open circles shows the slope of a regression of the 10 km monthly mean temperature anomalies against the near surface temperature anomalies, as a function of the local rain rate.
  • Fig. 5. The gray dots are a scatterplot of the monthly mean 10 km temperature anomaly versus the monthly mean surface temperature anomaly (below 1 km). Each dot represents an average over all radiosonde stations in which the monthly mean rainfall rate exceeded 3 mm per day. The dashed line shows a best fit regression. The solid line shows the mean 10 km temperature anomaly calculated from grouping the surface temperature anomalies in bin sizes of 0.05 K.
  • Fig. 6. The black curve shows the local temperature response associated with a 1 ◦C increase in near surface (below 1 km) temperature. The dashed gray curve shows the amplification profile calculated using pseudoadiabatic assumptions. The blue curve show the coefficient of correlation between the local monthly and near surface temperature anomalies.
  • Fig. 7. The black solid curve shows the average lapse rate of the five radiosonde stations during the 10 yr period (1999–2008). The dashed gray curve is the lapse rate of a warmed temperature profile subjected to a 1 ◦C increase in near surface temperature, as described in the text. The horizontal bars denote the approximate heights of the melting level in the background and warmed atmospheres. Surface warming is associated with a shift in the lapse rate profile to a higher altitude, by an amount roughly equal to the displacement in the melting level.
  • Fig. 8. The curve shows the change in pressure as a function of height associated with a 1 ◦C increase in near surface temperature. It was derived from a slope of a scatterplot, at each height, of the monthly mean pressure anomaly against the monthly mean near surface temperature anomaly.

References Powered by Scopus

2437Citations
1020Readers
1101Citations
315Readers

This article is free to access.

Cited by Powered by Scopus

This article is free to access.

Get full text
42Citations
29Readers

This article is free to access.

Register to see more suggestions

Mendeley helps you to discover research relevant for your work.

Already have an account?

Cite

CITATION STYLE

APA

Folkins, I. (2013). The melting level stability anomaly in the tropics. Atmospheric Chemistry and Physics, 13(3), 1167–1176. https://doi.org/10.5194/acp-13-1167-2013

Readers over time

‘13‘14‘15‘17‘19‘2000.751.52.253

Readers' Seniority

Tooltip

PhD / Post grad / Masters / Doc 5

63%

Professor / Associate Prof. 3

38%

Readers' Discipline

Tooltip

Earth and Planetary Sciences 7

78%

Environmental Science 1

11%

Chemistry 1

11%

Save time finding and organizing research with Mendeley

Sign up for free
0