Abstract
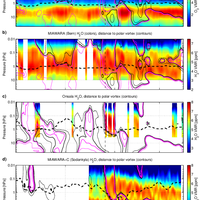
In this study, we present middle atmospheric water vapor (H 2O) and ozone (O 3) measurements obtained by ground-based microwave radiometers at three European locations in Bern (47° N), Onsala (57° N) and Sodankylä (67° N) during Northern winter 2009/2010. In January 2010, a major sudden stratospheric warming (SSW) occurred in the Northern Hemisphere whose signatures are evident in the ground-based observations of H 2O and O 3. The observed anomalies in H 2O and O 3 are mostly explained by the relative location of the polar vortex with respect to the measurement locations. The SSW started on 26 January 2010 and was most pronounced by the end of January. The zonal mean temperature in the middle stratosphere (10 hPa) increased by approximately 25 Kelvin within a few days. The stratospheric vortex weakened during the SSW and shifted towards Europe. In the mesosphere, the vortex broke down, which lead to large scale mixing of polar and midlatitudinal air. After the warming, the polar vortex in the stratosphere split into two weaker vortices and in the mesosphere, a new, pole-centered vortex formed with maximum wind speed of 70 m s -1 at approximately 40° N. The shift of the stratospheric vortex towards Europe was observed in Bern as an increase in stratospheric H 2O and a decrease in O 3. The breakdown of the mesospheric vortex during the SSW was observed at Onsala and Sodankylä as a sudden increase in mesospheric H 2O. The following large-scale descent inside the newly formed mesospheric vortex was well captured by the H 2O observations in Sodankylä. In order to combine the H 2O observations from the three different locations, we applied the trajectory mapping technique on our H 2O observations to derive synoptic scale maps of the H 2O distribution. Based on our observations and the 3-D wind field, this method allows determining the approximate development of the stratospheric and mesospheric polar vortex and demonstrates the potential of a network of ground-based instruments. © 2012 Author(s).
Figures
![Fig. 1. ECMWF PV (upper panels) and Aura MLS H2O (lower panels) on the 3300 K isentropic surface (approximately 0.1 hPa) overlaid by the edge of the polar vortex (black contour) during the period of the major SSW in January 2010. PV is given in [pvu], which corresponds to 10−6 K m2 kg−1 s−1. H2O is given in VMR as parts per million [ppm]. Red (blue) colors correspond to relatively high (low) values. Dates from left to right: 15 January, 23 January, 30 January, 7 February and 14 February 2010. The average wind speed along the vortex edge is shown in the caption of the subplots.](https://s3-eu-west-1.amazonaws.com/com.mendeley.prod.article-extracted-content/images/8cec514a-0ecd-3a49-a72a-ff31551d4e58/thumbnail-d5d099e6-73f1-4670-bb5d-26e9ed553417-0.png)
![Fig. 2. As in Fig. 1, but on the 1800 K isentropic surface (approximately 1 hPa) and showing Aura MLS CO VMR [ppm] instead of H2O in the lower panel.](https://s3-eu-west-1.amazonaws.com/com.mendeley.prod.article-extracted-content/images/8cec514a-0ecd-3a49-a72a-ff31551d4e58/thumbnail-559d51ad-c656-4ef4-9b96-ec74b9320ecc-1.png)
![Fig. 3. As in Fig. 1, but on the 800 K isentropic surface (approximately 10 hPa) and showing Aura MLS N2O VMR [parts per billion, ppb] instead of H2O in the lower panel.](https://s3-eu-west-1.amazonaws.com/com.mendeley.prod.article-extracted-content/images/8cec514a-0ecd-3a49-a72a-ff31551d4e58/thumbnail-606f46b5-5b4f-4af9-aba1-3b9f5f27efbe-2.png)
![Fig. 4. Latitude-time cross sections of the zonal mean temperature [K] from Aura MLS (upper panels) and zonal mean zonal wind [m s−1] from ECMWF (lower panels) during northern winter 2009/2010 at 0.1 and 10 hPa. Date markers indicate the first day of the month. The black dashed line indicates the beginning of the major SSW in the stratosphere. In the zonal wind plots, red (blue) colors correspond to eastward (westward) wind.](https://s3-eu-west-1.amazonaws.com/com.mendeley.prod.article-extracted-content/images/8cec514a-0ecd-3a49-a72a-ff31551d4e58/thumbnail-73ce59f1-b0d1-4436-a4a3-87f18338016d-3.png)
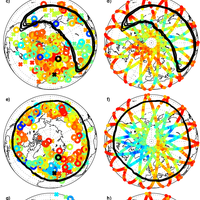
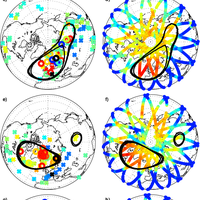
![Fig. 5. Upper panel: projections of the edge of the polar vortex for 23 January, 31 January, 7 February and 14 February 2010 (from left to right). Colors indicate the geopotential height in [km]. The black cross indicates Bern, the black diamond Onsala and the black circle Sodankylä. Lower panel: corresponding 3-D representation of the polar vortex. The colors indicate average wind speed [m s−1] along the vortex edge. The vertical black line indicates Bern, the magenta line Onsala and the green line Sodankylä.](https://s3-eu-west-1.amazonaws.com/com.mendeley.prod.article-extracted-content/images/8cec514a-0ecd-3a49-a72a-ff31551d4e58/thumbnail-fa3195f8-a02c-41da-a704-37ae997f292b-4.png)
Register to see more suggestions
Mendeley helps you to discover research relevant for your work.
Cite
CITATION STYLE
Scheiben, D., Straub, C., Hocke, K., Forkman, P., & Kämpfer, N. (2012). Observations of middle atmospheric H 2O and O 3 during the 2010 major sudden stratospheric warming by a network of microwave radiometers. Atmospheric Chemistry and Physics, 12(16), 7753–7765. https://doi.org/10.5194/acp-12-7753-2012
