Thermal conductivity of snow measured by three independent methods and anisotropy considerations

80Citations
Citations of this article
113Readers
Mendeley users who have this article in their library.

Abstract

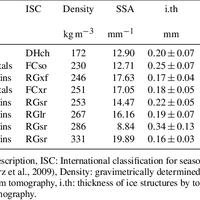
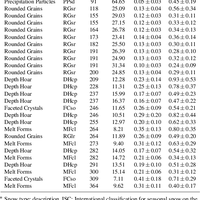
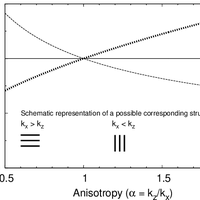
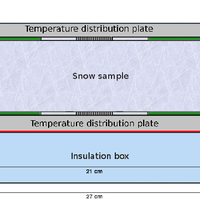
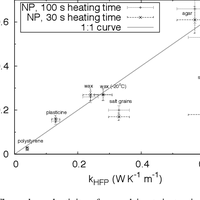
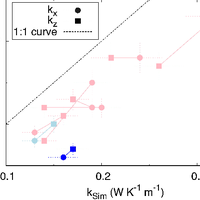
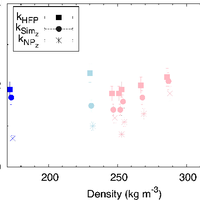
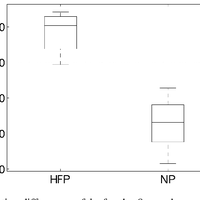
The thermal conductivity of snow determines the temperature gradient, and by this, it has a direct effect on the rate of snow metamorphism. It is therefore a key property of snow. However, thermal conductivities measured with the transient needle probe and the steady-state, heat flux plate differ. In addition, the anisotropy of thermal conductivity plays an important role in the accuracy of thermal conductivity measurements. In this study, we investigated three independent methods to measure snow thermal conductivity and its anisotropy: a needle probe with a long heating time, a guarded heat flux plate, and direct numerical simulation at the microstructural level of the pore and ice structure. The three methods were applied to identical snow samples. We analyzed the consistency and the difference between these methods. As already shown in former studies, we observed a distinct difference between the anisotropy of thermal conductivity in small rounded grains and in depth hoar. Indeed, the anisotropy between vertical and horizontal thermal conductivity components ranges between 0.5-2. This can cause a difference in thermal conductivity measurements carried out with needle probes of up to -25 % to +25 % if the thermal conductivity is calculated only from a horizontally inserted needle probe. Based on our measurements and the comparison of the three methods studied here, the direct numerical simulation is the most reliable method, as the tensorial components of the thermal conductivity can be calculated and the corresponding microstructure is precisely known. © Author(s) 2013. CC Attribution 3.0 License.

Figures

  • Table 1. Structural properties of the snow samples used for the intercomparison of the different measurement methods∗.
  • Table 2. Structural properties of the additional snow samples used for the simulation of thermal conductivity anisotropy∗.
  • Fig. 1. The effect of anisotropy of snow on the vertical component of thermal conductivity (kz) if thermal conductivity is measured with a horizontally inserted NP. Calculations are based on Grubbe et al. (1983). The range of the anisotropy factor between 0.5 and 2 is typical for natural snow. The horizontal line at 0.2 W m−1 K−1 indicates the measured thermal conductivity with the NP horizontally inserted. For an anisotropy factor, α < 1, kz is underestimated by up to 25 %. In case of α > 1, kz is underestimated by up to 25 %. Also shown is the horizontal component of the thermal conductivity, kx = kNPv , which corresponds to the value measured with a vertically inserted NP.
  • Fig. 2. Design of the HFP (Köchle, 2009). PC: polycarbonate plate, HFS: heat flux sensor, TC: thermocouples. HFS and TC are in the center of the PC plate.
  • Fig. 3. Thermal conductivity of several inert, isotropic materials measured with the heat flux plate (HFP) and the needle probe (NP). HFP and NP have similar values for inert, non-porous materials. Measurements with NP in agar are known to be too high due to convection (Boumaza and Redgrove, 2003). The NP measures a too low a value compared to the HFP for the porous materials (granular salt grains and sintered sea salt). The kNP resulting from a 100 s instead of a 30 s measurement increases thermal conductivity almost threefold for the sintered salt block.
  • Fig. 4. Comparison of the horizontal and vertical component of the thermal conductivity from direct numerical simulation, kSIM and needle probe measurement, kNP. All measurements, except two, show the same trend in anisotropy, however all components of kNPx,z are systematically lower than kSIMx,z . Colors correspond to the International classification for seasonal snow on the ground (Fierz et al., 2009). Light pink: rounded grains, light blue: faceted crystals, blue: depth hoar.
  • Fig. 5. Comparison of the vertical components of the thermal conductivity, kz for the three methods. HFP gave always the highest value and the NP the lowest one, the SIM is close to HFP. The bars indicate estimated error. Colors correspond to the International classification for seasonal snow on the ground (Fierz et al., 2009). Light pink: rounded grains, light blue: faceted crystals, blue: depth hoar.
  • Fig. 6. Relative differences of kz for the 8 samples used for both HFP and NP with SIM as reference. HFP values are 20 % higher, NP values are 35 % lower than those obtained by SIM. The median of the relative differences is the line inside the box; the top and the bottom of the boxes are the quartiles.

References Powered by Scopus

Review of the vapour pressures of ice and supercooled water for atmospheric applications

1067Citations
N/AReaders
Get full text

Soil thermal conductivity: Effects of density, moisture, salt concentration, and organic matter

518Citations
N/AReaders
Get full text

The thermal conductivity of seasonal snow

491Citations
N/AReaders
Get full text

Cited by Powered by Scopus

Measurement of the physical properties of the snowpack

165Citations
N/AReaders
Get full text

Density, specific surface area, and correlation length of snow measured by high-resolution penetrometry

112Citations
N/AReaders
Get full text

Intercomparison of snow density measurements: Bias, precision, and vertical resolution

81Citations
N/AReaders
Get full text

Register to see more suggestions

Mendeley helps you to discover research relevant for your work.

Already have an account?

Cite

CITATION STYLE

APA

Riche, F., & Schneebeli, M. (2013). Thermal conductivity of snow measured by three independent methods and anisotropy considerations. Cryosphere, 7(1), 217–227. https://doi.org/10.5194/tc-7-217-2013

Readers over time

‘13‘14‘15‘16‘17‘18‘19‘20‘21‘22‘23‘24‘2507142128

Readers' Seniority

Tooltip

PhD / Post grad / Masters / Doc 56

68%

Researcher 21

26%

Professor / Associate Prof. 4

5%

Lecturer / Post doc 1

1%

Readers' Discipline

Tooltip

Earth and Planetary Sciences 42

54%

Environmental Science 16

21%

Engineering 15

19%

Physics and Astronomy 5

6%

Save time finding and organizing research with Mendeley

Sign up for free
0