A thermodynamic approach to link self-organization, preferential flow and rainfall-runoff behaviour

N/ACitations
Citations of this article
64Readers
Mendeley users who have this article in their library.

Abstract

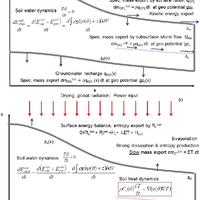
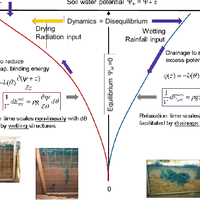
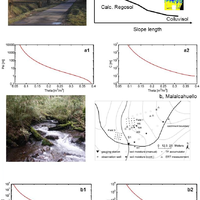
This study investigates whether a thermodynamically optimal hillslope structure can, if existent, serve as a first guess for uncalibrated predictions of rainfall-runoff. To this end we propose a thermodynamic framework to link rainfall-runoff processes and dynamics of potential energy, kinetic energy and capillary binding energy in catchments and hillslopes. The starting point is that hydraulic equilibrium in soil corresponds to local thermodynamic equilibrium (LTE), characterized by a local maximum entropy/minimum of free energy of soil water. Deviations from LTE occur either due to evaporative losses, which increase absolute values of negative capillary binding energy of soil water and reduce its potential energy, or due to infiltration of rainfall, which increases potential energy of soil water and reduces the strength of capillary binding energy. The amplitude and relaxation time of these deviations depend on climate, vegetation, soil hydraulic functions, topography and density of macropores. Based on this framework we analysed the free energy balance of hillslopes within numerical experiments that perturbed model structures with respect to the surface density of macropores. These model structures have been previously shown to allow successful long-term simulations of the water balances of the Weiherbach and the Malalcahuello catchments, which are located in distinctly different pedological and climatic settings. Our findings offer a new perspective on different functions of preferential flow paths depending on the pedological setting. Free energy dynamics of soil water in the cohesive soils of the Weiherbach is dominated by dynamics of capillary binding energy. Macropores act as dissipative wetting structures by enlarging water flows against steep gradients in soil water potential after long dry spells. This implies accelerated depletion of these gradients and faster relaxation back towards LTE. We found two local optima in macropore density that maximize reduction rates of free energy of soil water during rainfall-driven conditions. These two optima exist because reduction rates of free energy are, in this case, a second-order polynomial of the wetting rate, which implicitly depends on macroporosity. An uncalibrated long-term simulation of the water balance of the Weiherbach catchment based on the first optimum macroporosity performed almost as well as the best fit when macroporosity was calibrated to match rainfall-runoff. In the Malalcahuello catchment we did not find an apparent optimum density of macropores, because free energy dynamics of soil water during rainfall-driven conditions is dominated by increases of potential energy. Macropores act as dissipative drainage structures by enhancing export of potential energy. No optimum macropore density exists in this case because potential energy change rates scale linearly with the wetting rate. We found, however, a distinguished macroporosity that assures steady-state conditions of the potential energy balance of the soil, in the sense that average storage of potential energy is compensated by average potential energy export. This distinguished macroporosity was close to the value that yielded the best fit of rainfall-runoff behaviour during a calibration exercise and allowed a robust estimate of the annual runoff coefficient. Our findings are promising for predictions in ungauged catchments (PUB) as the optimal/distinguished model structures can serve as a first guess for uncalibrated predictions of rainfall-runoff. They also offer an alternative for classifying catchments according to their similarity of the free energy balance components. © Author(s) 2013.

Figures

  • Fig. 1. Free energy dynamics of a hillslope during rainfall-/massflow-driven conditions; (a) potential energy input from rainfall (Eq. 5), kinetic energy export by means of overland flow (Eq. 6), changes in free energy of soil water arising from changes in soil water content (capillary binding energy and potential energy; compare Eqs. 2 and 7) as well as export of water mass at different potential energy levels (please refer to Eq. 7). Free energy dynamics of a hillslope during radiation-driven conditions; (b) components of the surface energy balance (i.e. net radiation, sensible and latent heat fluxes) as well as soil heat dynamics triggered by the soil heat flux. Note that the soil heat budget is linked to soil water dynamics as the volumetric heat capacity Cv(θ) and thermal conductivity α(θ) depend on the actual soil water content θ .
  • Figure 2: Local thermodynamic equilibrium in soil as state of zero soil water potential. Drying causes deviations to negative values by increasing absolute values of negative capillary binding energy, wetting causes deviations to positive values by increasing potential energy of soil water. Note that the change in capillary binding energy per unit soil moisture change scales non-linearly with the slope of the soil water retention curve, which is a fingerprint of
  • Fig. 3. (a) A typical view on the Weiherbach valley (left) and diagram of the typical spatial organization at the hillslope scale: typical catena and observed typical dye tracer patterns characterizing infiltration in the different soil types. Panels a1 and a2 show the soil water retention curve and its (decreasing) slope as a function of soil water content. (b) Typical view of the Malalcahuello catchment (left) and overview of the experimental area, including the soil water retention curve and its slope plotted against soil water content.
  • Table 1. Laboratory measurements of average hydraulic properties for typical Weiherbach soils (after van Genuchten, 1980, and Mualem, 1976): saturated hydraulic conductivity ks, porosity θs, residual water content θr, air entry value α, shape parameter n.
  • Fig. 4. (a) Stretch close to the Weiherbach brook with simulated macropores as connected soil structures. Shown is the log to the saturated hydraulic conductivity. (b) Digital elevation model, slope lines of steepest descent (solid green) and channel network (solid blue) that compile the catchment model. On the left one can see the soil pattern and the deterministic pattern of macroporosity assigned to each hillslope. (c) Hillslope and location of grid nodes for the Malalcahuello catchment: different line colours symbolize different boundary conditions (red: no flux; blue: seepage; yellow: gravity flow; green: atmospheric). On the right one can see the sequence of soil layers; the red arrow symbolizes the large macroporosity factor that had to be assigned to the top 80 cm to fit observed specific discharge.
  • Fig. 5. Free energy balance components of numerical experiment 1. The left panels (a), (c), (e), and (g) belong to the wet initial saturation of S = 0.8, the right panels to the dryer initial saturation of 0.6. Please note that kinetic energy export by surface runoff deceases with macropore density, while changes in capillary binding energy increase with macropore density. Time series of potential energy input by rainfall (a and b), kinetic energy export by surface runoff (c and d), temporally averaged change rates in potential energy, the absolute value of capillary binding energy and free energy of soil water (e an ; compa e Eq. 7) and the time series of free energy components of soil water (g and f, after Eq. 2).
  • Fig. 6. Averaged reduction in absolute values of capillary binding energy (blue dots, a, c, e), enlargement of potential energy (black dots, b, d, f) and reduction of free energy of soil water (red dots, a, c, e, Eq. 8) for numerical experiment 1. Average initial saturation decreases from top to the bottom panels as indicated in panels from 0.8 over 0.6 to 0.4.
  • Figure 10 presents the free energy balance components of the 30 model runs as function of the macroporosity factor. Note that the values were averaged across all time steps where rainfall occurred. Average changes of total free energy of soil water are indeed negative (panel a), which corroborates that reduction rates of capillary binding energy (panel b, in fact of their absolute values) dominate against the increases in potential energy (panel c). Kinetic energy export by means of overland flow decreases with increasing fmac because overland flow production decreases with enhanced infiltrability (Fig. 10c). Increase rates in potential energy in soil water (Fig. 10d) show at first a steep increase when infiltrability in upslope areas is increasing (which needs larger fmac values), followed by a slower increase with increasing macroporosity. Reduction rates in the strength of capillary binding energy are on average 3 times larger than changes in potential energy and they peak at two local maxima at fmac values of 1.45 and 2.0 respectively. The location of the first optimum is very close to the macroporosity that yielded the best fit of observed rainfall–runoff behaviour. The local maxima are, as expected, not very sharp. This may be explained by the fact that reduction rates in the two different soils peak at slightly different fmac values. The reduction rates of total free energy show a very similar dependence on macroporosity to reduction rates of capillary binding energy; the local maxima are located at the same positions.

Register to see more suggestions

Mendeley helps you to discover research relevant for your work.

Already have an account?

Cite

CITATION STYLE

APA

Zehe, E., Ehret, U., Blume, T., Kleidon, A., Scherer, U., & Westhoff, M. (2013). A thermodynamic approach to link self-organization, preferential flow and rainfall-runoff behaviour. Hydrology and Earth System Sciences, 17(11), 4297–4322. https://doi.org/10.5194/hess-17-4297-2013

Readers over time

‘14‘15‘16‘17‘18‘19‘20‘21‘22‘23‘24‘25036912

Readers' Seniority

Tooltip

PhD / Post grad / Masters / Doc 29

54%

Researcher 18

33%

Professor / Associate Prof. 6

11%

Lecturer / Post doc 1

2%

Readers' Discipline

Tooltip

Earth and Planetary Sciences 19

40%

Environmental Science 17

36%

Engineering 9

19%

Computer Science 2

4%

Save time finding and organizing research with Mendeley

Sign up for free
0