Abstract
Available data show that future changes in global change drivers may lead to an increasing impact of fires on terrestrial ecosystems worldwide. Yet, fire regime changes in highly humanised fire-prone regions are difficult to predict because fire effects may be heavily mediated by human activities We investigated the role of fire suppression strategies in synergy with climate change on the resulting fire regimes in Catalonia (north-eastern Spain). We used a spatially-explicit fire-succession model at the landscape level to test whether the use of different firefighting opportunities related to observed reductions in fire spread rates and effective fire sizes, and hence changes in the fire regime. We calibrated this model with data from a period with weak firefighting and later assess the potential for suppression strategies to modify fire regimes expected under different levels of climate change. When comparing simulations with observed fire statistics from an eleven-year period with firefighting strategies in place, our results showed that, at least in two of the three sub-regions analysed, the observed fire regime could not be reproduced unless taking into account the effects of fire suppression. Fire regime descriptors were highly dependent on climate change scenarios, with a general trend, under baseline scenarios without fire suppression, to large-scale increases in area burnt. Fire suppression strategies had a strong capacity to compensate for climate change effects. However, strong active fire suppression was necessary to accomplish such compensation, while more opportunistic fire suppression strategies derived from recent fire history only had a variable, but generally weak, potential for compensation of enhanced fire impacts under climate change. The concept of fire regime in the Mediterranean is probably better interpreted as a highly dynamic process in which the main determinants of fire are rapidly modified by changes in landscape, climate and socioeconomic factors such as fire suppression strategies. © 2013 Brotons et al.
Figures
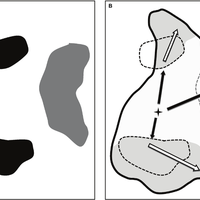
![Figure 1. Location of Catalonia in the European context (A). Dynamic land cover types in the year 2000 (B, see Appendix S2 for further information) with forest areas (in light grey) and shrublands (in dark grey). Representation of wildfires that occurred between 1975 and 1988 (light grey), between 1989 and 1999 (dark grey) and wildfires occurred between 2000 and 2010 (black) (C). Following [36], Catalonia is divided in three bioclimatic regions: North-West (NW), North-East (NE) and South-Central (SC). doi:10.1371/journal.pone.0062392.g001](https://s3-eu-west-1.amazonaws.com/com.mendeley.prod.article-extracted-content/images/c8ddca69-9e11-34c9-8e92-0a010fd9f9a1/thumbnail-7be72964-9f2e-4843-a6c0-d1a0a99d4108-0.png)
Register to see more suggestions
Mendeley helps you to discover research relevant for your work.
Cite
CITATION STYLE
Brotons, L., Aquilué, N., de Cáceres, M., Fortin, M. J., & Fall, A. (2013). How Fire History, Fire Suppression Practices and Climate Change Affect Wildfire Regimes in Mediterranean Landscapes. PLoS ONE, 8(5). https://doi.org/10.1371/journal.pone.0062392
