Assessment of long-term WRF-CMAQ simulations for understanding direct aerosol effects on radiation "brightening" in the United States

36Citations
Citations of this article
42Readers
Mendeley users who have this article in their library.

Abstract

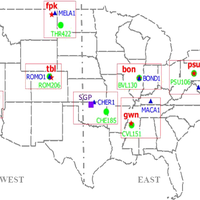
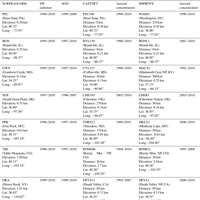
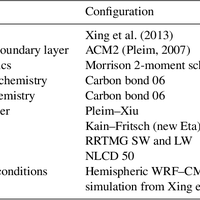
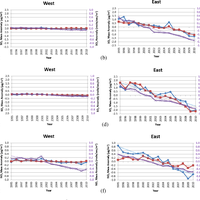
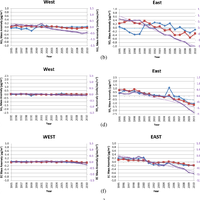
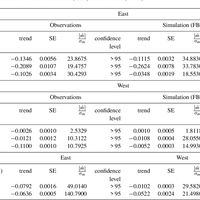
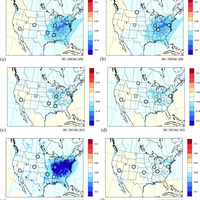
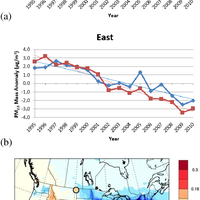
Long-term simulations with the coupled WRF-CMAQ (Weather Research and Forecasting-Community Multi-scale Air Quality) model have been conducted to systematically investigate the changes in anthropogenic emissions of SO2 and NOx over the past 16 years (1995-2010) across the United States (US), their impacts on anthropogenic aerosol loading over North America, and subsequent impacts on regional radiation budgets. In particular, this study attempts to determine the consequences of the changes in tropospheric aerosol burden arising from substantial reductions in emissions of SO2 and NOx associated with control measures under the Clean Air Act (CAA) especially on trends in solar radiation. Extensive analyses conducted by Gan et al. (2014a) utilizing observations (e.g., SURFRAD, CASTNET, IMPROVE, and ARM) over the past 16 years (1995-2010) indicate a shortwave (SW) radiation (both all-sky and clear-sky) "brightening" in the US. The relationship of the radiation brightening trend with decreases in the aerosol burden is less apparent in the western US. One of the main reasons for this is that the emission controls under the CAA were aimed primarily at reducing pollutants in areas violating national air quality standards, most of which were located in the eastern US, while the relatively less populated areas in the western US were less polluted at the beginning of this study period. Comparisons of model results with observations of aerosol optical depth (AOD), aerosol concentration, and radiation demonstrate that the coupled WRF-CMAQ model is capable of replicating the trends well even though it tends to underestimate the AOD. In particular, the sulfate concentration predictions were well matched with the observations. The discrepancies found in the clear-sky diffuse SW radiation are likely due to several factors such as the potential increase of ice particles associated with increasing air traffic, the definition of "clear-sky" in the radiation retrieval methodology, and aerosol semi-direct and/or indirect effects which cannot be readily isolated from the observed data.

Figures

  • Figure 1. Locations of various sites in the SURFRAD, ARM, CASTNET, and IMPROVE networks. This figure is adapted from Fig. 1 of Gan et al. (2014a).
  • Table 1. Listing of site identification of each site for different networks and their measurement period which are used in this study. Distance means the approximate distance between SURFRAD/ARM sites and CASTNET or IMPROVE sites. This table is adapted from Gan et al. (2014a).
  • Table 2. List of model configuration.
  • Figure 2. Annual mean anomalies of 1995–2010 SO2− 4 (top panels), SO2 (middle panels), and NO − 3 (bottom panels) for CASTNET observations (blue line – primary y axis), model simulations (red line – primary y axis), and emissions (purple line – secondary y axis). Least-square fit trend lines are also shown for each time series. Note that SO2 emissions are paired with both SO2 and SO 2− 4 concentrations since most of the atmospheric SO2− 4 burden is due to secondary formation from SO2 rather than primary emissions of particulate SO 2− 4 . The left column represents the western US while the right column represents the eastern US.
  • Figure 3. Annual mean anomalies of 1995–2010 NO− 3 (top panels), SO2− 4 (middle panels), and EC (bottom panels) for IMPROVE observations (blue line – primary y axis), model simulations (red line – primary y axis), and emissions (purple line – secondary y axis). Least-square fit trend lines are also shown for each time series. Note that SO2 emissions are paired with both SO2 and SO4 concentrations since most of the atmospheric SO2− 4 burden is due to secondary formation from SO2 rather than primary emissions of particulate SO 2− 4 . The left column represents the western US while the right column represents the eastern US.
  • Table 3. Trends of 16 years for CASTNET observations, aerosol feedback (FB) simulation, and emissions. The table also shows the uncertainty estimates of the trends (standard error, SE), the ratio of the absolute trends relative to their uncertainty estimate, and the confidence level based on the method described in Weatherhead et al. (1998) and Gan et al. (2014a).
  • Figure 4. Map of annual trends based on 1995–2010 coupled WRF–CMAQ simulations over the CONUS domain are depicted along with circles representing observed trends for seven sites. Left column for SO2− 4 (top panels), NO− 3 (middle panels), and SO2, (bottom panels) from the CASTNET network while the right column is for SO2− 4 (top panels), NO− 3 (middle panels), and EC (bottom panels) from the IMPROVE network. Note that the size of the circle represents the level of the significance. A larger circle indicates more significance.
  • Figure 5. Annual mean anomalies of 1995–2010 PM2.5 in the (a) western and (b) eastern US from IMPROVE for observations (blue line) and model simulations (red line). Least-squares fit trend lines are also shown for each time series. (c) Map of PM2.5 annual trends based on 1995–2010 coupled WRF–CMAQ simulations over the CONUS domain depicted along with circles representing the observed trends for seven sites. Note that the size of the circle represents the level of the significance. A larger circle indicates more significance.

References Powered by Scopus

This article is free to access.

352Citations
180Readers
Get full text

Cited by Powered by Scopus

This article is free to access.

Register to see more suggestions

Mendeley helps you to discover research relevant for your work.

Already have an account?

Cite

CITATION STYLE

APA

Gan, C. M., Pleim, J., Mathur, R., Hogrefe, C., Long, C. N., Xing, J., … Wei, C. (2015). Assessment of long-term WRF-CMAQ simulations for understanding direct aerosol effects on radiation “brightening” in the United States. Atmospheric Chemistry and Physics, 15(21), 12193–12209. https://doi.org/10.5194/acp-15-12193-2015

Readers over time

‘15‘16‘17‘18‘19‘20‘21‘22‘24‘25036912

Readers' Seniority

Tooltip

PhD / Post grad / Masters / Doc 14

52%

Researcher 10

37%

Professor / Associate Prof. 3

11%

Readers' Discipline

Tooltip

Environmental Science 14

52%

Earth and Planetary Sciences 7

26%

Chemistry 3

11%

Engineering 3

11%

Article Metrics

Tooltip
Mentions
News Mentions: 1

Save time finding and organizing research with Mendeley

Sign up for free
0