Abstract
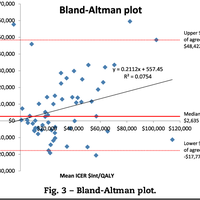
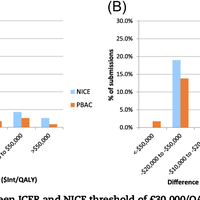
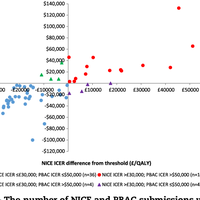
Objectives: The English National Institute for Health and Care Excellence (NICE) and the Australian Pharmaceutical Benefits Advisory Committee (PBAC) require evidence that a new medicine represents value for money before being publicly funded. NICE has an explicit threshold for cost effectiveness, whereas PBAC does not. We compared the initial incremental cost-effectiveness ratios (ICERs) presented by manufacturers in matched submissions to each decision-making body, with the aim of exploring the impact of an explicit threshold on these ICERs. Methods: Data were extracted from matched submissions from 2005 to 2015. The ICERs in these submissions were compared within each pair and with respect to a cost-effectiveness threshold. Results: Fifty-eight pairs of matched submissions were identified. The median difference between the ICERs ($2635/quality-adjusted life year [QALY]) was significantly greater than zero (Wilcoxon signed-rank test, P = 0.0299), indicating that the proposed ICERs in the submissions to NICE were higher than those in the matched submissions to PBAC. On 93% of occasions, NICE ICERs were within –$17,772 to +$48,422 of the corresponding PBAC ones (Bland-Altman analysis), demonstrating poor agreement. When an implicit threshold of AUD$50,000/QALY was assumed for PBAC decision making, only eight pairs of submissions had discordant ICERs falling above or below the respective threshold. Conclusions: The significantly higher ICERs in the submissions to NICE than those to PBAC may be a consequence of NICE's explicit willingness-to-pay threshold, and/or other health system factors. Industry may be assuming an implicit threshold for PBAC when constructing their ICERs despite the lack of acknowledgement of such a threshold.
Figures
Author supplied keywords
Register to see more suggestions
Mendeley helps you to discover research relevant for your work.
Cite
CITATION STYLE
Wang, S., Gum, D., & Merlin, T. (2018). Comparing the ICERs in Medicine Reimbursement Submissions to NICE and PBAC—Does the Presence of an Explicit Threshold Affect the ICER Proposed? Value in Health, 21(8), 938–943. https://doi.org/10.1016/j.jval.2018.01.017
